


AI in agriculture and farming now sits inside everyday tools that sense fields, analyse patterns and automate routine work. The strongest gains come from precision operations, computer vision in scouting and automation that frees teams to focus on decisions. In practice, artificial intelligence in agriculture means using models to turn imagery, sensor data and records into prescription maps and timely alerts that improve input use, timing and labour efficiency.
AI technology stack on the farm
Modern agri AI works when data, models and apps fit together. Below is a pragmatic blueprint that software teams and farm operators can ship and maintain.
Data sources and instrumentation
- Remote sensing from satellites and drones with vegetation indices such as NDVI and EVI.
- IoT sensors for soil moisture, microclimate and equipment telemetry.
- Machinery data from guidance systems and controllers with equipment interoperability standards such as ISOBUS.
- Farm records in an FMIS, including inputs, jobs and yields.
- Weather feeds and seasonal outlooks, plus field observations and photos.
Data pipeline and MLOps
- Ingestion and storage across time series, geospatial and object storage with searchable metadata and versioning.
- Feature engineering for agronomic signals such as growth stage, heat stress and soil water deficit.
- Model training for use cases such as yield prediction, disease risk and prescription mapping with routine calibration to control drift.
- Deployment with monitoring of precision, recall and latency, and active learning loops from new field labels.
- Edge ready packaging through model distillation and quantisation using portable formats such as ONNX.
Edge and connectivity patterns
- On device inference on tractors, drones and mobiles for offline work.
- Store and forward synchronisation to the cloud when coverage returns.
- Low power sensor links such as LoRa and NB IoT for wide fields.
- Caching of maps, prescriptions and models on devices so jobs continue without a live link.
Applications and interfaces
- FMIS modules for job planning, prescriptions and traceability.
- Mobile field apps for scouting, photo capture and alert validation.
- Geospatial dashboards for zones, anomalies and task queues.
- Copilots for agronomy and operations with retrieval augmented generation over farm knowledge and playbooks.
Key takeaways
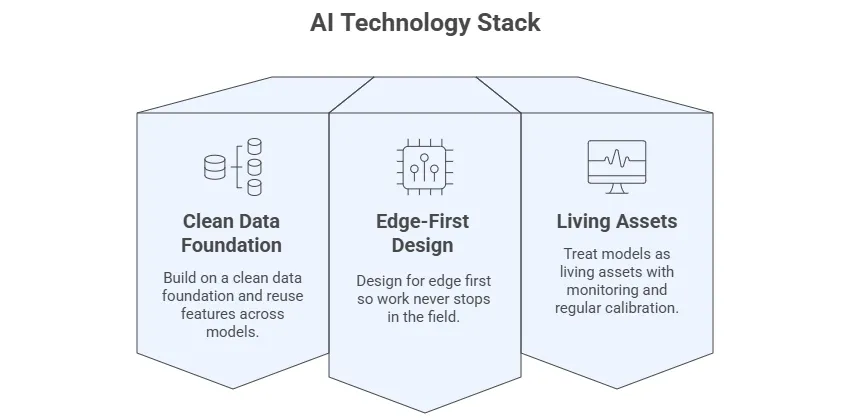
- Build on a clean data foundation and reuse features across models.
- Design for edge first so work never stops in the field.
- Treat models as living assets with monitoring and regular calibration.
Precision operations with artificial intelligence
AI helps place inputs where they add value. The core loop is sense, decide and act.
Imagery choice for crop monitoring
- Drones give very high resolution and flexible timing for small to medium blocks. They are ideal for diagnostics and prescription fine tuning.
- Satellites provide wide coverage and regular revisits at low cost. They are ideal for seasonal pattern tracking and prioritising scouting routes.
Drone versus satellite imagery for AI crop monitoring
Factor | Drone UAV | Satellite |
Ground resolution | Centimetre level | Around 10 m bands typical |
Revisit and timing | On demand with flight windows | Frequent scheduled passes |
Weather limits | Wind and rain restrict flights | Cloud limits optical bands |
Coverage | Field or block scale | Regional to national |
Cost model | Per flight or service | Public or low cost sources |
Best use | Diagnostics and prescription detail | Variability mapping and planning |
Tip. Map with satellites to set priorities, then verify with drones to explain causes and refine actions.
Variable rate workflow
- Build zones from soil sampling, yield maps and elevation.
- Select imagery windows, calculate indices and layer with ground truth.
- Generate prescription maps for seeding, fertiliser and spraying.
- Run trial strips against a fixed rate to measure uplift.
- Confirm machine compatibility and section control, then execute and log in the FMIS.
- Review results with an agronomist and update logic for the next pass.
Irrigation scheduling with AI
- Combine soil moisture sensors, evapotranspiration estimates and short range forecasts.
- Predict stress windows and set timing and volume by zone.
- Apply variable rate irrigation where hardware allows and record outcomes for tuning.
- Add leak detection and anomaly alerts that monitor overnight flows and pressure drops.
Yield prediction and planning
- Fuse time series of weather, satellite indices and field records.
- Use probabilistic models so plans factor uncertainty rather than single point guesses.
- Feed plans into harvest logistics and input purchasing to cut waste.
Key takeaways
- Start with one crop and two fields, then scale by similarity.
- Always compare against a fixed rate or previous practice to avoid wishful thinking.
- Keep prescriptions, telemetry and records interoperable so data flows without friction.
AI-driven development
WislaCode software makes your employees' daily work faster and more intuitive.
Computer vision and automation
Vision models find patterns early and robots act precisely where they are needed.
Disease and pest detection workflow
- Capture leaves and canopy views by drone, rig or phone at planned growth stages.
- Run object detection or segmentation models to surface likely symptoms and weed pressure.
- Prioritise alerts by confidence, risk and growth stage.
- Validate in the field. Record present or absent, severity and action taken.
- Feed labels back into training. Use active learning so the model focuses on hard cases next.
Intelligent spraying and weeding
- Spot spraying reduces chemical use by targeting only detected patches.
- Camera guided implements control sections in real time to avoid overlap.
- Robotic weeders manage rows mechanically where crop geometry allows.
- Keep an operator in the loop with pause and override controls.
Livestock health and behaviour
- Vision models track gait, posture and feeding to flag lameness or stress early.
- Wearables and collars detect heat, calving and rumination changes.
- Tune diet and environment through continuous feedback to improve welfare and output.
Key takeaways
- Use human validation to build trust and to keep false alarms low.
- Automate actuation only when safeguards and logs are in place.
- Measure outcomes such as treated area, chemical use and recovery time rather than model scores alone.
Governance, interoperability and ROI
Technology must be trustworthy and pay its way. Keep governance lightweight and practical.
Human in the loop and data quality
- Write a short playbook for alert review, thresholds and actions.
- Track precision and recall at the use case level and by season.
- Refresh models after major weather or practice changes.
Data protection and vendor due diligence
- Set clear roles for data control and processing in line with data protection laws such as GDPR.
- For enterprise buyers, ask for an information security management system aligned with ISO 27001 and for an external SOC 2 Type II report.
- Prefer platforms with exportable data formats and open APIs to avoid lock in.
- If your solution embeds payments or financial features, consider the impact of financial conduct and payments rules such as FCA guidance and PSD2 in the relevant market.
Cost versus value at a glance
Use case | Relative setup cost | Ongoing cost | Main value drivers | Typical measurable outcomes | Payback horizon |
Precision operations with variable rate | Medium to high if new sensors or drone mapping are needed. Lower when using public imagery and existing kit | Medium for imagery, analytics and data management | Input optimisation, fewer overlaps, better stand uniformity, labour and fuel efficiency | Reduction in fertiliser per hectare, fewer passes, better uniformity and yield stability | One to three seasons depending on hectares and variability |
Computer vision for disease and pests | Low to medium with existing cameras or a drone service. Higher with specialised rigs | Low to medium for model subscription, periodic flights and validation time | Avoided yield loss, targeted sprays, better timing | Fewer blanket passes, earlier treatment, reduced severity and treated area | One to two seasons, varies with pressure year to year |
Checklist to pilot then scale in 90 days
- Define two measurable objectives such as input reduction and earlier treatment timing.
- Pick one crop and two fields with different variability.
- Set up data inputs and a simple validation plan with control strips.
- Confirm equipment and FMIS compatibility and test a full data round trip.
- Hold a mid pilot review at day 45 and adjust scope to what works.
- Document a scale plan with roles, training and a modest budget.
- Schedule a post harvest review and update the playbook for the next season.
WislaCode builds end to end artificial intelligence software for agriculture, including computer vision pipelines for scouting, geospatial analytics for prescription mapping and edge ready models that run on machines and mobiles. If you want a pilot to scale path with measurable outcomes, we can help you ship the stack and prove value fast.
How do I build a production‑ready AI stack for the farm?
Build an edge‑first, offline‑capable stack backed by cloud MLOps. Ingest geospatial, time‑series and imagery into a unified store, then ship small models to devices for on‑device inference. Use a feature store, event‑driven pipelines and monitoring for precision, recall and latency. Distil and quantise models to INT8 and export via ONNX or TensorRT for tractors, drones and mobiles. Add a lightweight copilot with retrieval‑augmented generation over playbooks and FMIS records. Cache maps and prescriptions locally and sync when coverage returns.
How should we validate disease and pest detection before acting?
Start with field truthing on a labelled sample and measure precision, recall and false positive rate per crop and growth stage. Keep humans in the loop, run advisory alerts first, then A/B test spot spraying against fixed‑rate passes. Set confidence thresholds, sample edge cases, and log present or absent plus severity and action. Use active learning so the model focuses on hard errors, and retrain after major weather or practice changes. Automate only when performance is stable and auditable.
What components are needed for AI‑driven irrigation scheduling?
Combine soil moisture probes, evapotranspiration estimates and short‑range forecasts to predict stress windows by zone. Feed the plan to controllers or variable‑rate irrigation, then record volumes and timings back to the FMIS. Add leak detection and anomaly alerts that watch overnight flows and pressure drops. Calibrate thresholds per soil type and crop stage, and review results weekly to refine timing and dose. Where bandwidth is limited, run scheduling on the edge and sync summaries later.
Which computer vision models are practical for edge devices on farm machines?
Use lightweight detectors and segmenters that meet tight memory and latency budgets. Practical picks include YOLOv5n or v8n for detection, MobileNetV3 or EfficientNet‑Lite for classification, and SegFormer‑B0 or DeepLabv3‑lite for canopy segmentation. Quantise to INT8, crop streams, and batch frames to smooth throughput. Export to ONNX or TensorRT and profile on the target GPU or NPU. Keep a simple fallback, such as thresholding, if the model drops below a set confidence.
Do AI farming apps need to comply with GDPR and security standards?
Yes. If you process personal or farm‑identifiable data you must comply with GDPR, define controller and processor roles, and run a DPIA where risks are high. Enterprise buyers often require ISO 27001 for the ISMS and a SOC 2 Type II report for operational controls. If your app embeds payments or credit, PSD2 and local financial‑conduct rules such as FCA guidance may apply. Prefer exportable formats and open APIs for portability. Encrypt data in transit and at rest and keep audit trails.
When should I choose drones over satellites for crop monitoring?
Use drones for diagnostics, small plots and time‑critical windows when you need centimetre‑level detail. Use satellites for wide‑area variability mapping, season‑long tracking and very low marginal cost. Many teams use a hybrid approach: satellites to prioritise where to look, drones to explain causes and refine prescriptions. Factor wind and flight windows, cloud cover, compliance and the hectares you must cover each week.
How do I prove ROI in the first 90 days?
Scope two measurable goals and run control strips against current practice. Pilot one variable‑rate pass or spot spraying on two contrasting fields and instrument inputs, fuel, labour time and time‑to‑alert. Track reduction in fertiliser per hectare, treated area, overlaps, rework and recovery time after interventions. Log everything in the FMIS, compare with controls and estimate a payback horizon in seasons. If outcomes are positive, freeze the workflow and scale by similarity.